Graph Options
After the data has been plotted, a number of options are available to alter the colors and look of the plot.
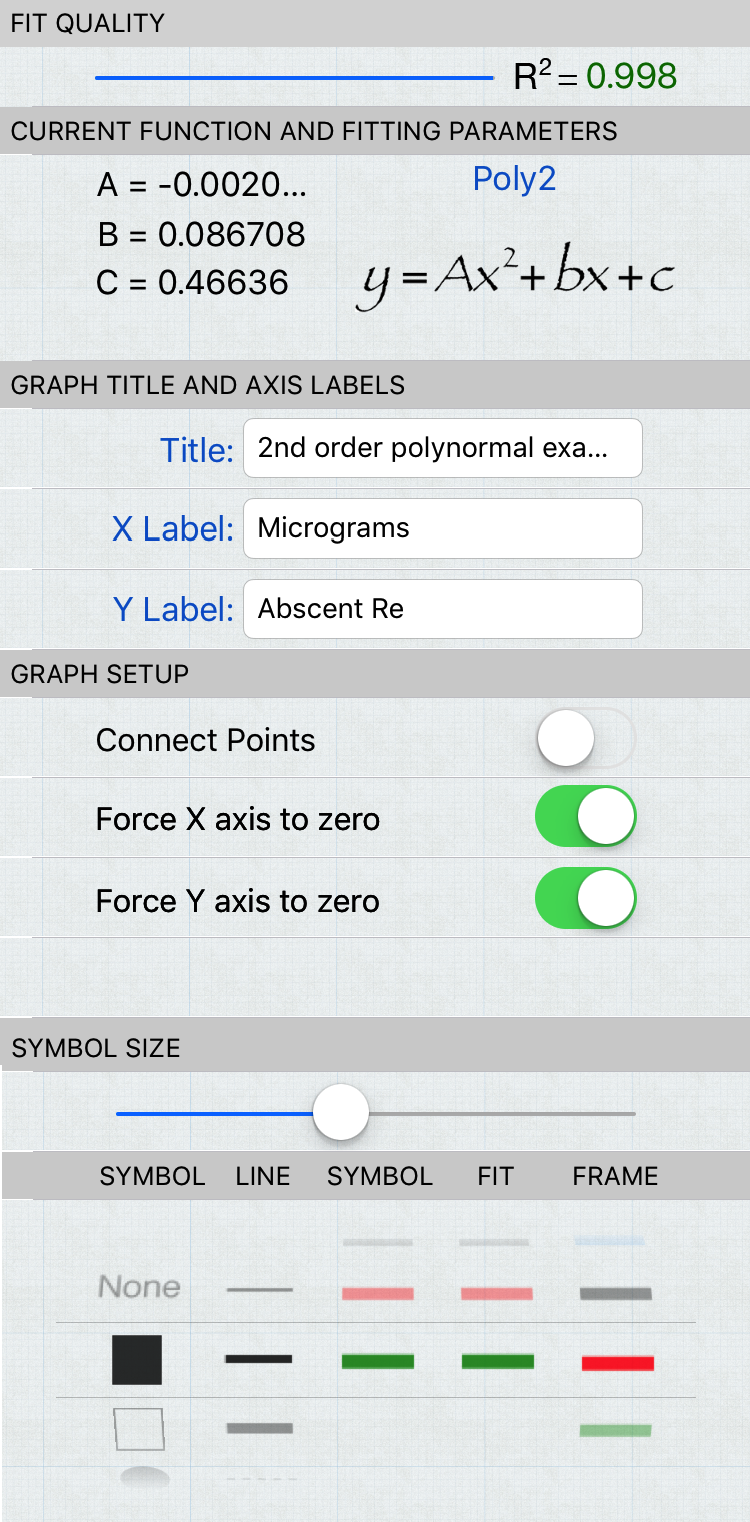
The bottom portion of the graphics page is a scrollview with a variety of options (see the entire options scrollview on the right).
Graph Title and Axes Labels. In this section the user can add or change the title, or the labels of the X and Y axis.
Graph Setup. In this section the user change change certain aspects of how the graph is presented.
Connect Points: ON, will connect the points, drawing a line segment between each point. No fitting of the data occurs.
Force X and Force Y axis to zero: ON, will start the X and Y axis respectively at zero, independent of what the xmin and ymin values are.
Symbol Size. The slider can be used to change the symbol size.
Symbol, Line and Color Picker. The picker can be used to change:
- The type of symbol
- The type of line (solid or dashed) as well as the thickness
- The symbol color
- The color of the line that indicates the theoretical fit
- The color of the graph frame