Simple linear fit
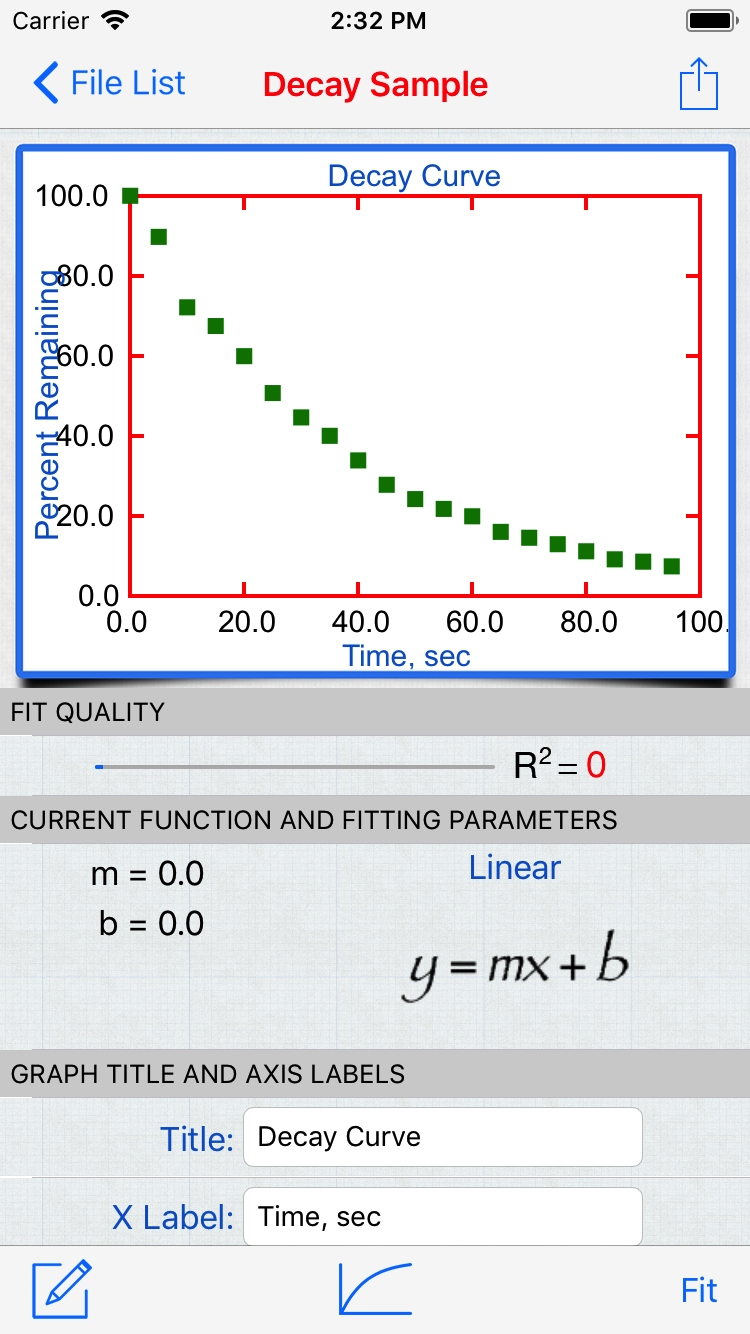
After pressing the Plot button on the Data Entry page, the graph is plotted and is shown at the top of the Graphics page.
The default function for the program is a linear fit (y = mx + b).
![]() The fit button begins the least-squares procedure. After the final parameters have been calculated the theoretical curve is drawn on the graph and the final parameters are shown.
The fit button begins the least-squares procedure. After the final parameters have been calculated the theoretical curve is drawn on the graph and the final parameters are shown.
 This button reveals the function selection screen. The user clicks on the function that will be used for the non-linear regression.