Non-Linear regression
After pressing the Plot button on the Data Entry page, the graph is plotted and is shown at the top of the Graphics page.
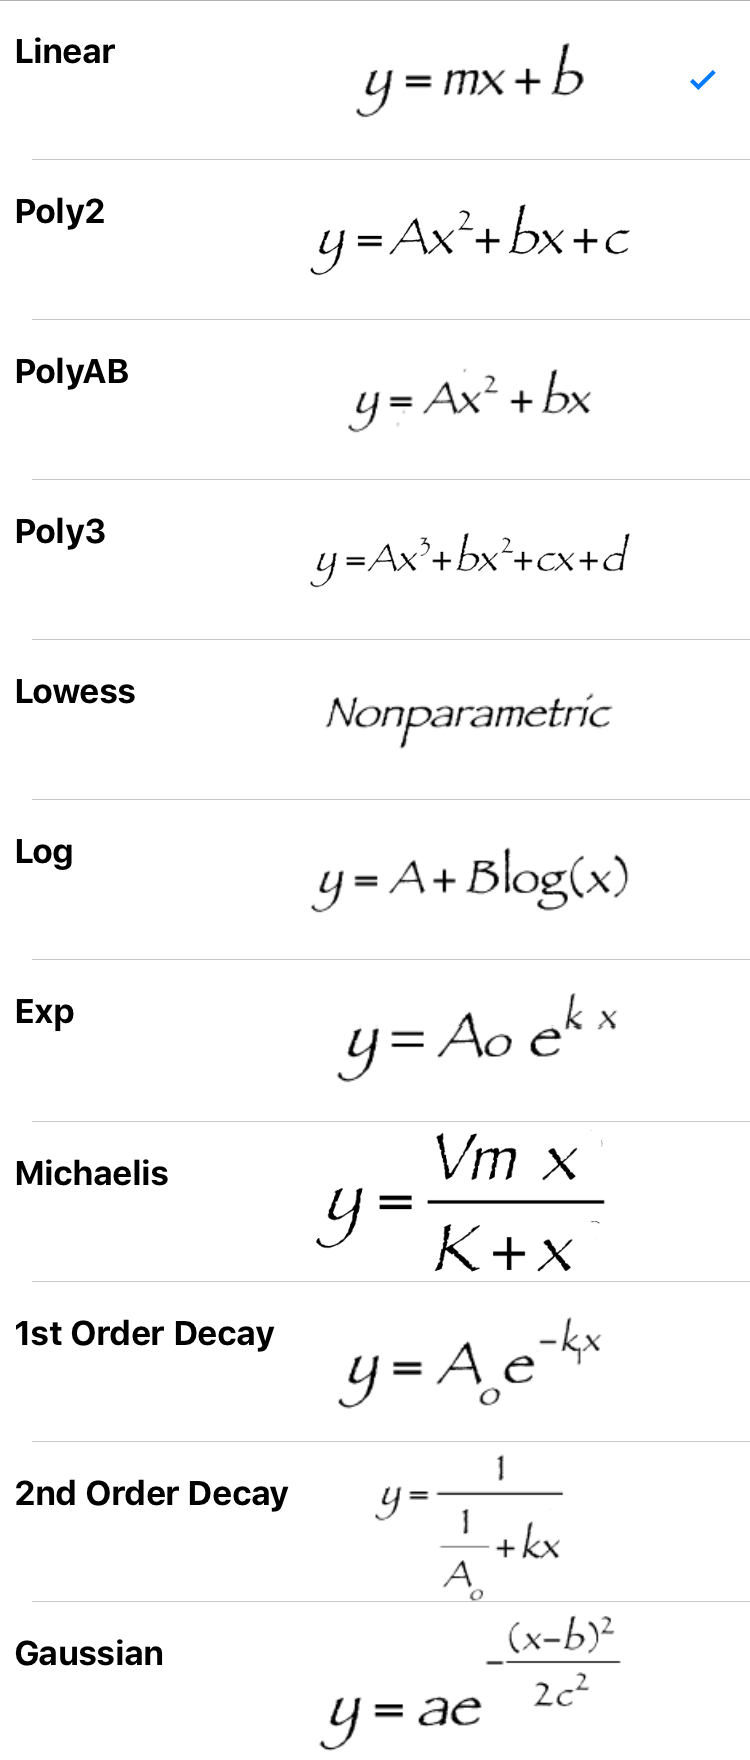
The default function for the program is a linear fit (y = mx + b).
 This button reveals the mathematical functions that can be selected for non-linear regression. See the Regression Functions section for a full description.
Simply press on the function to be used in the non-linear regression.